Chart of the Day – Coca-Cola (KO) Triggers a Powerful Bullish Breakout While Outperforming the Consumer Staples Sector

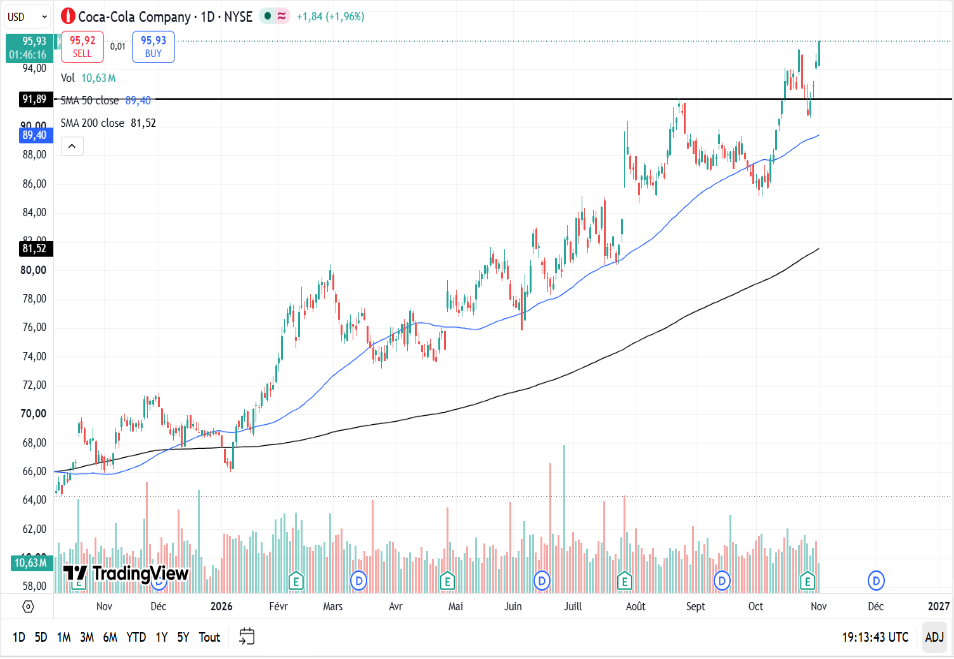
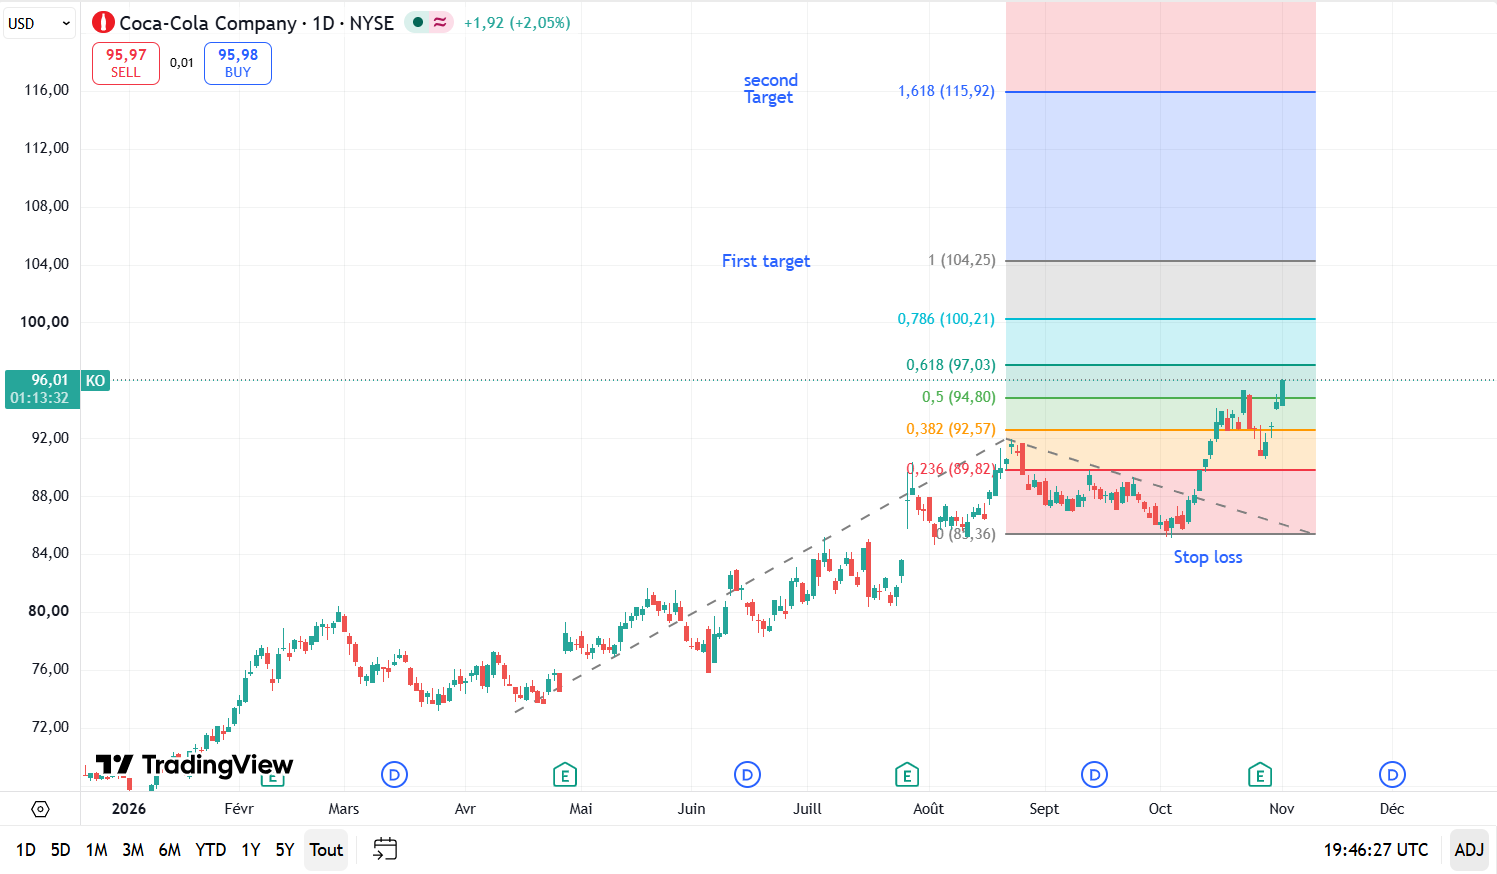
Coca-Cola (KO) has broken above its $91.89 resistance on higher volume and reached a new all-time high on 2 November 2026, while outperforming the consumer staples sector (XLP), which is itself starting to outperform the S&P 500. Here is the technical setup, the trading plan and the fundamental backdrop.
1. Technical analysis and trading plan
- Bullish breakout: the price broke above the $91.89 resistance on higher volume, by more than 3%, and stayed above it after a throwback on lower volume, reaching a new all-time high on 2 November 2026. This comes within a bullish price structure, with higher highs and higher lows, and a golden cross.
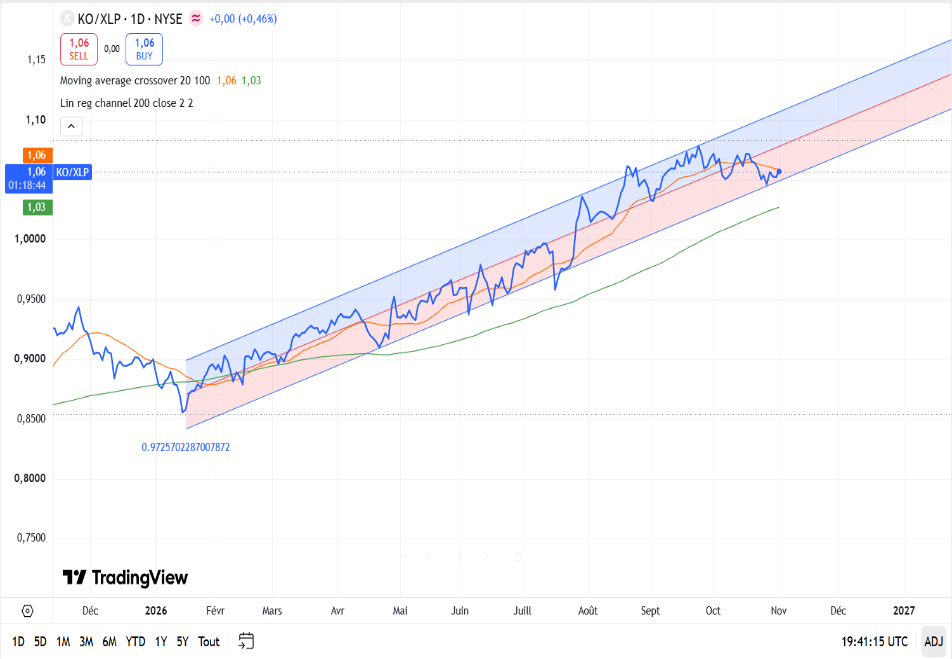
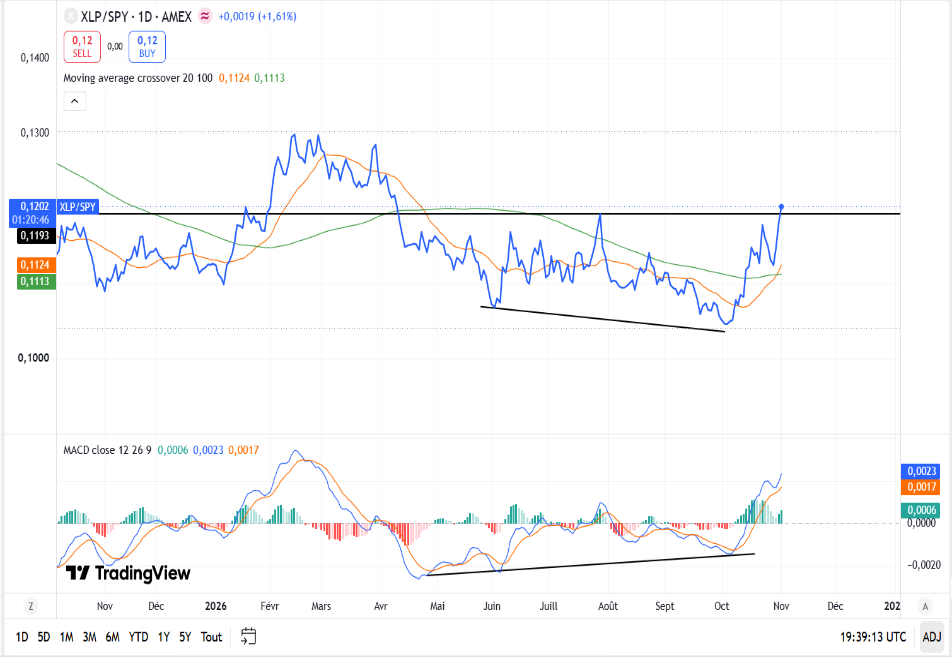
- Relative strength analysis: Coca-Cola is outperforming its benchmark, the consumer staples sector. The ratio chart between the two assets (KO/XLP) shows a pattern of higher highs and higher lows. Consumer staples is in turn starting to outperform the S&P 500: the XLP/SPY ratio chart shows a bullish trend reversal, following a bullish crossover between the 20 and 100 SMA on 30 October 2026 and a breakout above the previous high. This reversal comes after a bullish divergence on the MACD oscillator.
- Direction: Long (bullish).
- Entry trigger: market entry.
- Stop loss: $85.36, positioned slightly below the bottom of the short-term correction, to protect capital against trend invalidation.
- Take profit: the first target is $104.25, which corresponds to the replication of the previous rally. The second target is $115.92, which corresponds to the golden ratio.
2. Fundamental backdrop
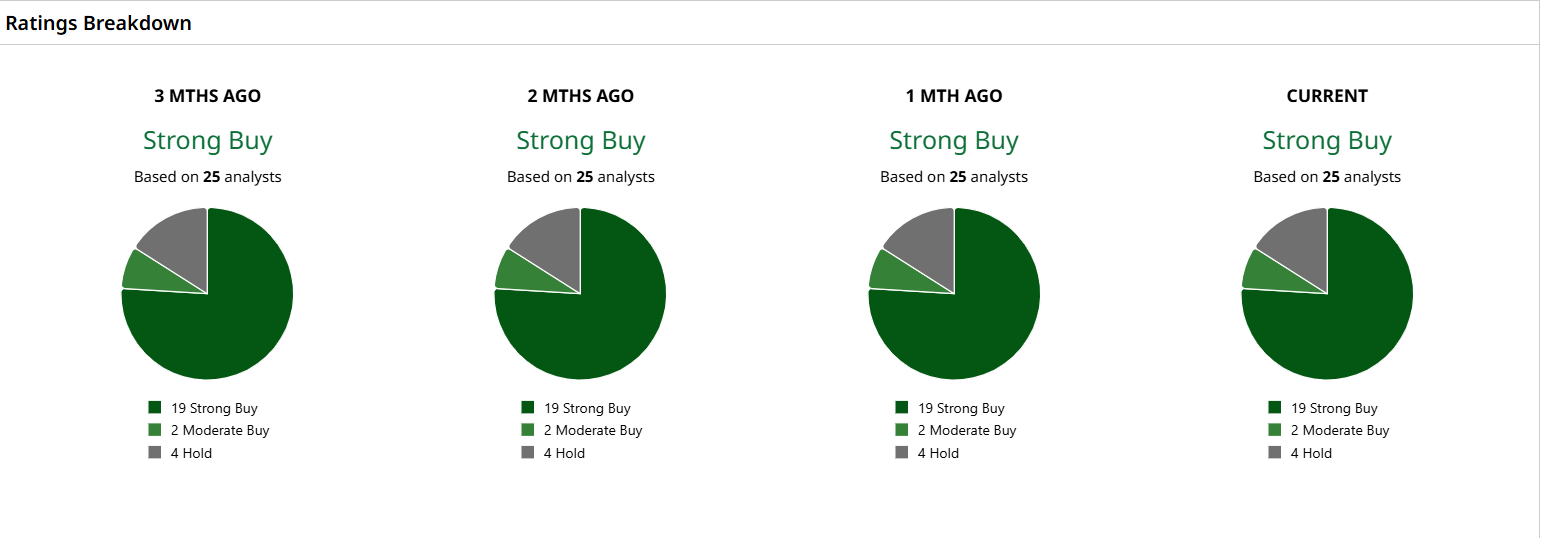
- Wall Street sentiment: institutional consensus stands at a rock-solid “Strong Buy”.
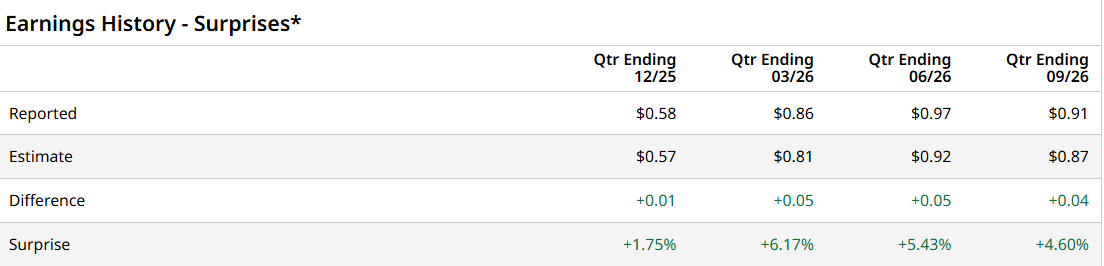
- Earnings track record: Coca-Cola has demonstrated strong operational execution, beating consensus EPS estimates for the past four consecutive quarters. This consistent track record of earnings surprises provides a solid fundamental backstop to the current technical breakout, confirming that institutional buying is driven by robust corporate performance rather than mere speculation.
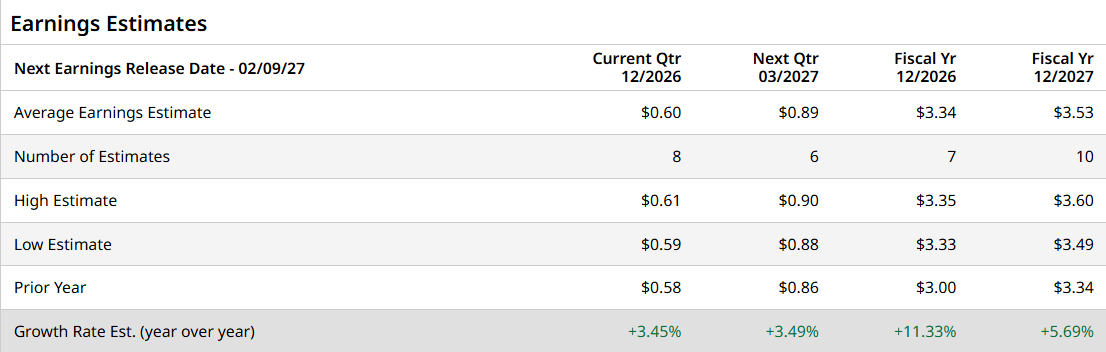
- Forward growth outlook: Wall Street consensus underscores a sustained expansion narrative for the upcoming quarters and fiscal years. Analysts project positive year-over-year (YoY) earnings growth for both Q4 2026 and Q1 2027. On a full-year basis, consensus estimates reflect double-digit bottom-line growth, with FY2026 EPS projected to rise about 11.33% YoY to $3.34, followed by an additional 5.69% expansion in FY2027 to $3.53. This forward-looking growth trajectory confirms that the technical breakout is anchored in strong fundamental acceleration.
Disclaimer: This document is provided strictly for educational and informational purposes as a macro-technical research assessment. It does not constitute personalized financial, investment, or legal advice. Fundamental and technical analyses are based on historical probabilities, and past performance is not indicative of future market results. Financial market trading, particularly involving equities, leveraged derivatives and stock market volatility, carries a substantial risk of capital loss and is not suitable for every investor. The author (Hamza El Missouri) accepts no liability for any direct or consequential financial loss arising from the use of the metrics, targets, or data presented in this study.
Enjoyed this article? Add JoinProp as a preferred source on Google.